Supercharge your eval-expression with ielm! 
With some tinkering customization, ielm can be a capable replacement
1. TLDR: why and when
I often use straight-visit-package and find-library to read the READMEs and
;; Commentary: sections in Elisp files. On top of that, I use Info quite
extensively - the manuals for Elisp and Org Mode are loaded with tons of useful
Elisp snippets.
The problem: while you can use C-x C-e almost everywhere, some of the places
listed above are read-only buffers (Info, built-ins from /usr/lib/), so if I
want to evaluate it in a slightly changed form (longer than one line, since that
would fit in eval-expression), I need to switch to scratch buffer, which is
pretty intrusive. With addition of IELM, my workflow looks like this:
- I'm reading code or docs in a read-only buffer.
- I find a piece of code I want to play with (modify and execute)
- If it's one line, I copy it to
M-:(eval-expression) - If it's up to 10 lines, I copy it to
C-M-:(ielm) - If it's longer, I copy it to
*scratch*buffer
In this post, I focus on pt. 4.
UPDATE: Another kind soul on Reddit (/u/deaddyfreddy) pointed at edit-indirect
package that could be a good replacement for this. I will take a look!
2. eval-expression / M-:
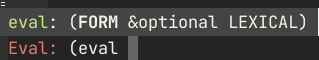
Bound under M-: by default, eval-expression allows you to quickly type any
Elisp and execute it in the context of current window and buffer. I think it's
one of my most used key bindings, after M-x. It supports TAB-completion, and
even shows help (function and macro signatures).
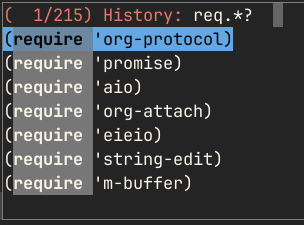
The input takes place in the minibuffer, which means it automatically keeps history of pevious invokations. You can search through that history, using your preferred completion styles, for example with Orderless (and Vertico, here) you can use regular expressions to get what you want:
Unfortunately, the minibuffer is not the best way to input more complex forms.
Multiline is possible, but tedious. Lack of enabled paredit hurts (and
enabling it messes up incomplete input handling). For these reasons, for trying
out longer pieces of code, I normally switch to the *scratch* buffer. The
downside of it is that I need to switch to a buffer, often losing sight of the
buffer I worked with before that.
Fortunately, there's a middle ground: ielm! It's documented with a single page
in the Emacs manual and just a handful of customizable options. By default, as
is usual for Emacs, it doesn't look or work too well, but with a bit of
configuration, it gets a lot better. Here's how I use it.
3. ielm / C-M-:
First, let's make ielm look better. As a replacement for eval-expression it
should display at the bottom of the frame. I also prefer it to reduce the
clutter - the default headaer and the prompt could use some tweaking:
 1: (cl-defun my-make-right-arrow-icon ()
 2:   "Return a string that displays arrow icon  when inserted in a buffer."
 3:   (propertize (all-the-icons-octicon "arrow-right")
 4:     'face `(:family ,(all-the-icons-octicon-family) :height 1.2)
 5:     'display '(raise 0)))
 6:
 7: ;; Make *ielm* buffer display in a side-window at the bottom of the frame
 8: (add-to-list 'display-buffer-alist
 9:              '("*ielm*"
10:                (display-buffer-in-side-window)
11:                (side . bottom)
12:                (window-height . 10)))
13:
14: (setq ielm-header "")
15: (setq ielm-prompt (concat (my-make-right-arrow-icon) " "))
16:
17: (keymap-global-set "C-M-:" #'ielm)
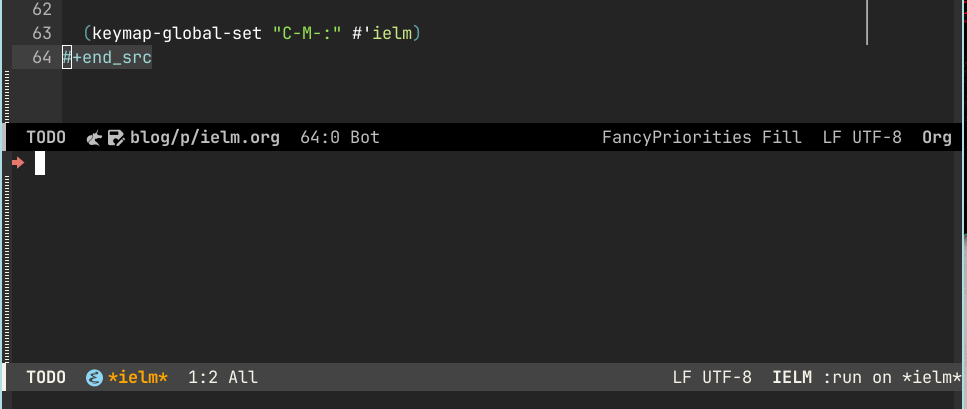
We use display-buffer-alist to add a rule for where and how *ielm* buffers
should show up, then remove the header (why waste a line?) and change the prompt
to a shorter one. We get this as a result:
Now, let's make the *ielm* buffer behave more like a normal Elisp buffer. I
have a lot of config already in place for Elisp, and since the buffer is not a
minibuffer, most of these will just work. So, I add a few hooks:
 1: ;; *ielm* buffer
 2: (add-hook 'ielm-mode-hook 'my-elisp-mode-setup) ; (1)
 3: (add-hook 'ielm-mode-hook 'my-ielm-mode-setup)
 4: (keymap-set ielm-map "C-M-:" #'kill-buffer-and-window) ; (2)
 5:
 6: ;; indirect buffer used by ielm to fontify elisp code
 7: (add-hook 'ielm-indirect-setup-hook #'rainbow-delimiters-mode) ; (3)
 8:
 9: (defun my-ielm-mode-setup ()
10:   (paredit-mode)
11:   (keymap-local-set "C-<return>" #'my-ielm-send-input) ; (4)
12:   (let ((map (copy-keymap paredit-mode-map)))
13:     (keymap-set map "<RET>" 'ielm-return)
14:     (push `(paredit-mode . ,map) minor-mode-overriding-map-alist)))
15:
16: (cl-defun my-ielm-send-input ()
17:   (interactive)
18:   ;; The pattern of: '<return> SHIT, I meant execute! C-/ C-<return>' repeats
19:   ;; iself often enough that automation seems warranted... :)
20:   (when (eq 'ielm-return last-command) (undo))
21:   (ielm-send-input))
my-elisp-mode-setup (at (1)) is a hook I run in normal Elisp buffers. It
enables tens of packages and messes with a lot of keybindings, you can see it on
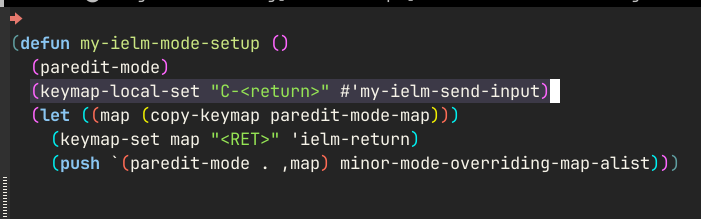
Github. my-ielm-mode-setup only overrides some key bindings - paredit
would normally hijack the RET key, so we use minor-mode-overriding-map-alist
to tell it not to do that. With that, we have a nice multiline editing,
structural editing with paredit, and fontification and indentation that work:
With ielm-dynamic-multiline-inputs and ielm-dynamic-return set, we can now
insert newlines normally as long as we're not at the very end of the input.
Having to move point to the end to execute the code can be tedious, so I bound
C-<return> to send the input immediately, no matter where the point currently
is.
Since this is a normal Elisp buffer, we can also use C-M-x and C-x C-e to
execute parts of the current input. That allows you to refine the input before
actually executing it.
Going further, one of the nice things about eval-expression is that it works
in the context of the current window and buffer. I didn't want to mess with how
IELM executes its input; instead, I made a little helper function:
 1: (keymap-global-set "C-M-:" #'my-run-ielm)
 2:
 3: (cl-defun my-run-ielm (arg)
 4:   (interactive "P")
 5:   (let ((buf (buffer-name (current-buffer))))
 6:     (ielm)
 7:     (when arg
 8:       (insert
 9:        (prin1-to-string
10:         (pcase arg
11:           ('(4) `(with-selected-window (get-buffer-window ,buf)))
12:           ('(16) `(with-current-buffer ,buf)))))
13:       (forward-char -1)
14:       (ielm-return))))
Now, when I want to execute some code in the context of a window or buffer I was
before invoking IELM, I can press C-u C-M-: or C-u C-u C-M-:. This is what I
get in that case:
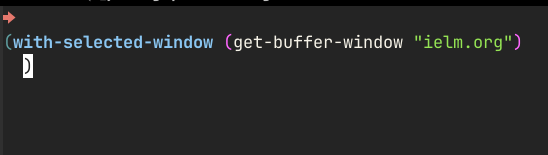
I can now use things like re-search-forward in the context of the window I was
in before switching to IELM - and see the point move as the command gets
executed.
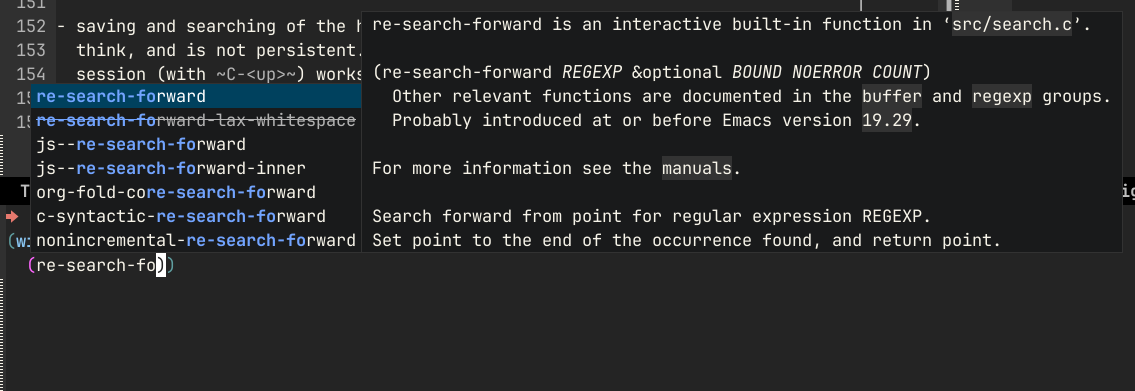
Finally, remember the "help" that eval-expression offers? Since *ielm* is a
normal buffer, it can do a lot more - for example, you can use it with Corfu:
Of course, all the other goodies you have configured for emacs-lisp-mode will
also work. This is the ultimate advantage of this solution over
eval-expression, in my opinion.
4. Conclusion
One thing missing is saving and searching of the history of commands. It's kept
in comint, I think, and is not persistent. Recalling previous commands in a
single IELM session (with C-<up>) works, but C-r starts an isearch of
the buffer instead of Orderless search with Vertico. This is something I still
need to figure out.
UPDATE: a kind soul over at Reddit (/u/FrankLeeMadear) provided the missing piece for me! Thank you, I will use it well! 🙂
 1: (defvar ielm-input-ring nil
 2:   "Global to hold value of input ring. Add this to savehist-additional-variables")
 3:
 4: (defun set-ielm-input-ring ()
 5:   ;; called only when ielm is current buffer
 6:   ;; init local var from global saved by savehist
 7:   (when ielm-input-ring
 8:     (setq comint-input-ring ielm-input-ring)))
 9:
10: (defun save-ielm-input-ring ()
11:   (let* ((buf (get-buffer "*ielm*"))
12:          (ring (and buf (buffer-local-value 'comint-input-ring buf))))
13:     (when ring
14:       (setq ielm-input-ring ring))))
15:
16: (add-hook 'ielm-mode-hook 'set-ielm-input-ring)
17: (add-hook 'savehist-save-hook 'save-ielm-input-ring)
18: (add-to-list 'ielm-input-ring 'savehist-additional-variables)
Other than that, I think this config fits nicely between eval-expression and
visiting an Elisp buffer (scratch or otherwise). I've been using this for a few
weeks to experiment and play with new libraries. Being able to choose in which
context the code will be executed is convenient, and the full power of
structural editing and completion with Corfu even for throwaway snippets helps a
lot when exploring and prototyping code.